
As HAND IN HAND keeps growing, I'm finding that one of the bigger challenges isn't necessarily adding more systems to the game.
It's figuring out how to show players what's actually happening.
We've got population, happiness, employment, electricity, water, land value, and all sorts of other things being calculated as the city runs.
But having those numbers working behind the scenes is one thing.
Giving players a way to understand them is something else entirely.
And the thing that finally pushed me to do something about it was pollution.
Just How Polluted Is My Town?
Pollution has been part of HAND IN HAND for quite a while now.
Industrial buildings produce pollution, and so do certain power and water facilities.
I've already been using pollution to affect residential happiness and development, but there's a problem.
How does a player actually know where the pollution is coming from?
You might know that putting a bunch of factories next to your houses is probably a bad idea, but how far away is far enough?
And does a small industrial building produce the same amount of pollution as a large one?
Of course not.
So I started working on a way for players to actually see the effects of pollution across their town.
Keeping Pollution Simple — For Now
The pollution system itself is still fairly straightforward.
Each industrial building has a pollution radius based on its development level.
A Level 1 industrial building produces pollution within a smaller area.
As it advances to Level 2 and Level 3, that radius increases.
Power stations and certain water facilities work in much the same way, producing pollution based on the type and level of the facility.
It's not an elaborate environmental simulation, but it does give players something meaningful to think about.
Where should I put my industrial area?
How far away should my residential neighbourhoods be?
Will a larger factory start affecting nearby homes that were previously outside its pollution range?
Those are decisions that become more interesting when players can actually see what's happening.
Eventually, I'd also like to include traffic pollution.
The idea would be that heavily travelled roads and areas with a lot of vehicle congestion could produce their own pollution effects.
But that's something for further down the road, once I've had more time to develop the traffic simulation.
For now, the building-based pollution radius system is what we're working with.
Introducing Info Views
That got me thinking about something.
If I'm going to build a visual display for pollution, why stop there?
We've already got several other systems using coverage areas or numerical calculations.
Fire protection, education, happiness, land value, electricity, water, and more.
So I decided to create a new Info Views tool.
The idea is to give players a way to switch between different visual representations of what's happening in their city.
Instead of clicking on individual buildings to inspect their information, you can select an Info View and see conditions across a much larger area.
Want to know which neighbourhoods have fire protection?
Select the Fire Safety view.
Want to understand where happiness is high or low?
Choose the Happiness view.
Trying to figure out why a certain part of town isn't developing?
The different information overlays should help identify what's missing.
It's essentially taking information the game is already calculating and presenting it in a way that's much easier to understand.
And I think that could make a pretty big difference as towns get larger.
The First Version
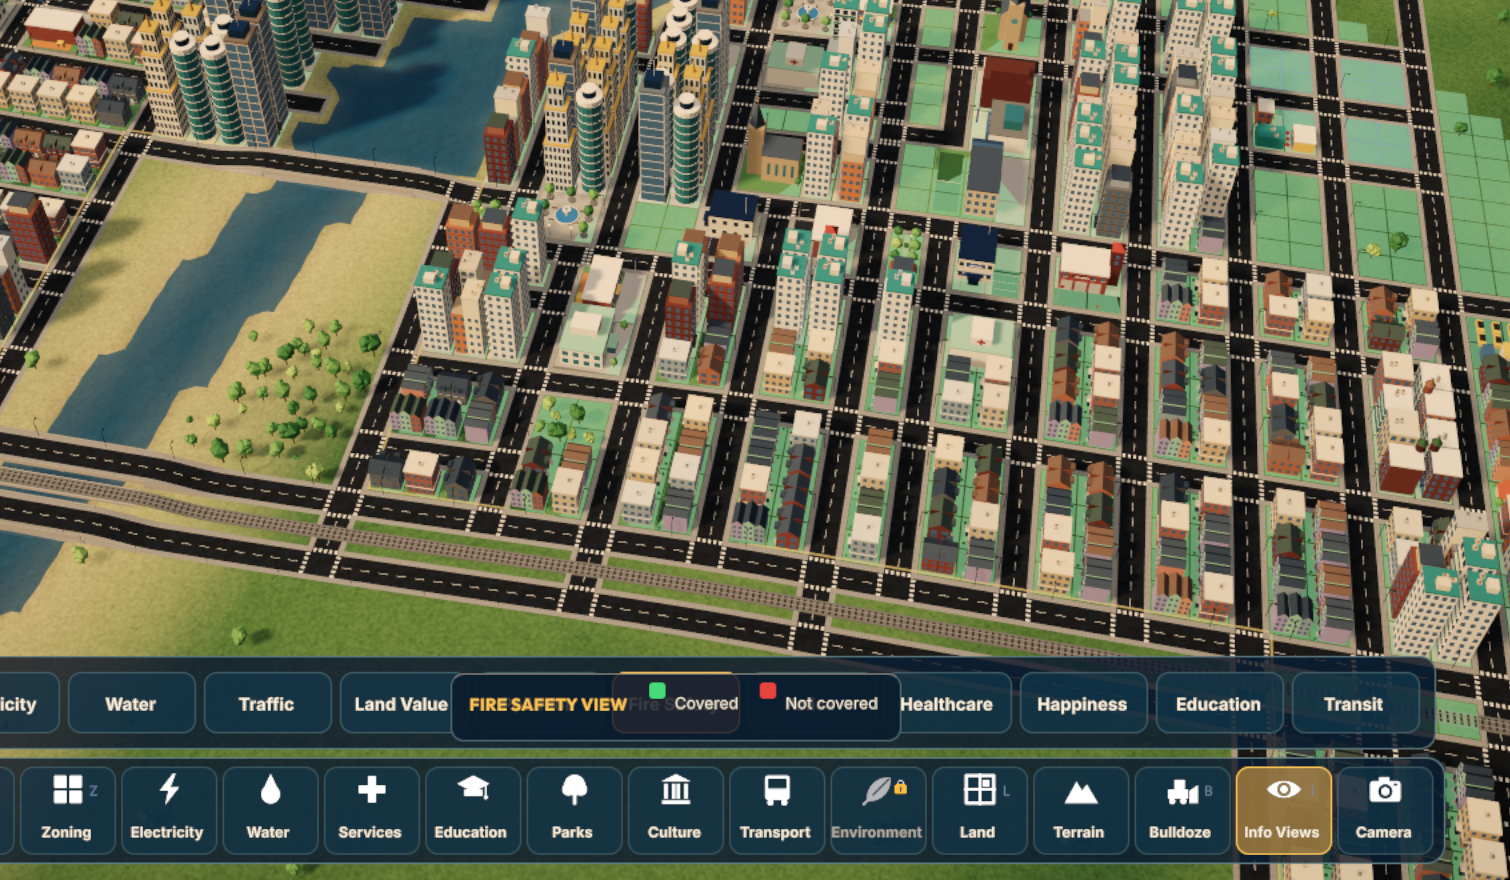
So I've put together the first version of the Info Views interface.
There's now an Info Views button on the bottom toolbar, which opens a row of different information categories.
Each selection is intended to display the relevant information across the city, along with a legend explaining what the colours mean.
The screenshot here shows the Fire Safety view.
Green represents areas with fire protection, while red identifies areas without coverage.
At least, that's the idea.
There's just one little problem.
The legend is sitting right on top of the selection buttons.
Apparently, in my excitement to get everything working, I didn't spend quite enough time figuring out where all the interface elements should actually go.
So you can select an information view, and the game will show you what you're looking at.
But the legend explaining it is currently doing a pretty good job of getting in the way.
Not exactly ideal.
Still, that's what these early versions are for.
Get the basic system working, see how it behaves, and then figure out how to make it better.
Back to the Drawing Board
Even with the layout problems, I like where this is heading.
It's already giving me a much better way to understand what's going on across a city.
And that's important because HAND IN HAND is becoming a game where a lot of different systems affect one another.
Pollution affects happiness.
Services affect development.
Land value helps determine how neighbourhoods grow.
Electricity and water need to support an expanding population.
Players shouldn't have to guess at all of those relationships.
The game needs to give them the tools to understand them.
So Version 1 of Info Views is working, even if the interface is a little messy.
Now it's time to go back, fix the layout, and make the whole thing easier to use.
Version 2, here we come.